Connect Primavera P6 to Power BI ❰❰EXCEL❱❱
We are in the era of reports and dashboards. Those moments where we want to have all the information available at our fingertips on one click. We have entered the era of interaction, dynamic reporting, database crossover. We have entered the Power BI era. That’s why at Project 2080 we want to show you how we can connect Primavera P6 to Power BI. Are you ready?
What is Power BI?
Power BI, according to Microsoft’s official website, “is a cloud-based business analytics service that provides you with a single view of the most crucial data in your business“. Power Bi helps us create dynamic and interactive dashboards. Powered through data sources such as Excel spreadsheets, cloud services, streaming data, and local databases. All this, located in the cloud and capable of keeping us informed in real-time, through a holistic view of the key metrics of your project or portfolio. With that said, and before we show you how to connect Primavera P6 to Power Bi, let’s see why Power BI is so important for planning and project controls.
Why is Power BI so important for Planning and Project Controls?
Power BI is important for the planning and project controls industry as it helps us provide a better service when it comes to preparing reports and dashboards for our clients. Dashboards based on the data analysis that feed our activity schedules, such as durations, dates, milestones, resources, costs, etc. In this way, we can even prepare reports about how to do the project schedule quality assessment in our portfolio.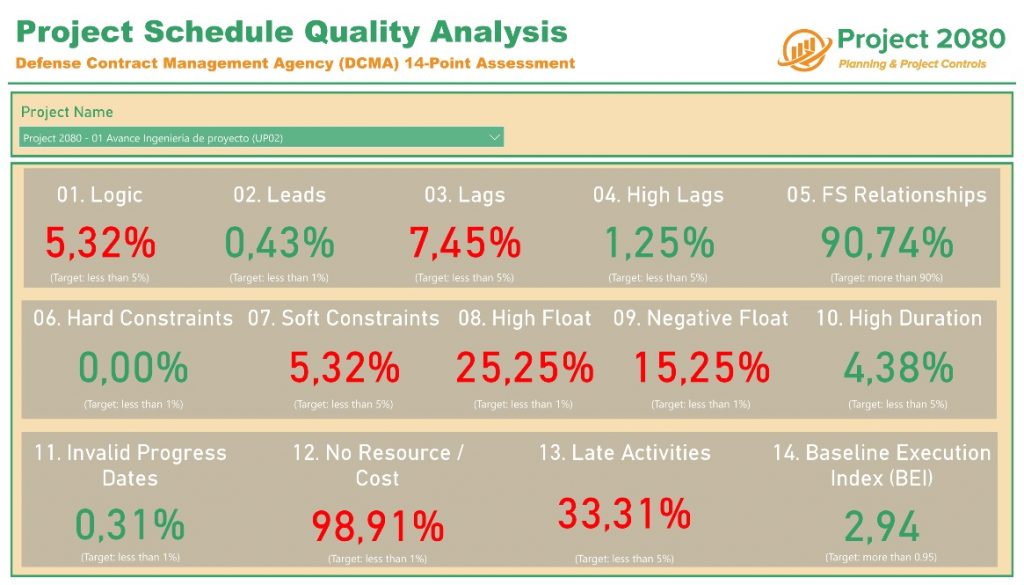
Planning and Project Controls have never experienced this evolution and improvement before. Our analysis function, based on the data that feeds us every day, and our help and support in making decisions within our projects, we are now able to do it in real-time, with reports in the cloud, on our mobiles.
And what about the artificial intelligence of Power BI. We can ask you questions like “what are the activities with a Soft Constraint?” and get an impressive, interactive visualization in return. Natural language has reached the planning and project controls industry.
In addition, we will now be able, on a single platform, to create and publish content packages for specific teams, clients, or entire organizations. Content personalization is no longer just a Netflix thing. Project 2080 has joined the bandwagon of content personalization related to planning and project controls. In this post, we are showing you the first steps, and the necessary tools to connect Primavera P6 to Power BI.
Chaos is over. Project 2080 puts the future of project management in the palm of your hand. We will make the most complex reports and topics of your projects attractive and accessible, and help you in your decision making.
Different ways to access Power BI
Currently, Power Bi has different products at our disposal:
- Power BI Desktop: the desktop version of Power BI. In it you will have access to all the necessary functionalities to develop your reports, such as connecting data sources, preparing, adapting, and modeling the data with ease. All this with the sole purpose of being able to analyze data, find patterns, and prepare interactive and personalized reports for your project team.
- Power BI Pro: through this option, you will be able to carry out more efficient data-driven collaboration. Share visualizations, distribute findings, access visualizations on the go, improve collaboration through team feedback, and even subscribe to content to stay up-to-date.
- Power BI Premium: offering an advanced self-service data preparation solution that enables all users and organizations to accelerate knowledge delivery and collaborate with ease.
- Power BI Mobile: take the knowledge with you anywhere. Always be connected to the data, wherever your projects take you. Mobile business intelligence is just a touch away.
- Power BI Embedded: utility to add your analytics and interactive reports to your own tools or websites.
- Power BI Report Server: this is the on-premises solution that enables you to create reports today, with the flexibility to move to the cloud tomorrow.
Learn to connect Primavera P6 to Power BI
Once we have shown you what Power BI is, including the different alternatives to access it, and we have seen the importance of Power BI in the field of planning and project controls, let’s move on to know how to connect Primavera P6 to Power BI.
A person who works in the planning and project control department of a company with the Primavera P6 tool, or another similar one, will know the importance of filters and the multiple ways to group and sort the data of our project. In other words, the planner is used to segmenting the project by different codes, by dates, by durations, by criticality, etc. A static model, at the same time complicated, to show the data in a view that we could even save it as a template or layout in P6.
It is there where Power BI opens a new path in the field of planning and project controls through its dynamic and intelligent visualizations. Do you want to show your activities within a range of dates? Would you like to know which are the 5 most critical activities within the foundations´WBS? Would you like to know what is the progress of the engineering phase of your project? All of this is within your reach, but it needs some prior preparation. Let’s start with the beginning.
Before we start with the step-by-step guide to connect Primavera P6 to Power Bi, we want you to know that there are 3 methods to get data from Oracle Primavera P6 planning tool to Microsoft Power BI:
- Copy the data from Primavera P6 and paste it into an Excel spreadsheet
- Use the Primavera P6 reporting tool and export it to a “.csv” file
- Connect Primavera P6 Database to Power BI
In this post, we will talk about the first method: “copy the data from Primavera P6 and paste it into an Excel spreadsheet”. However, we will cover the other two methods in depth in coming posts on our planning and project controls blog so that you can choose between any of them. Let´s go with the step-by-step guide to connect Primavera P6 to Power Bi.
Step 1: export data from Primavera P6 to Excel
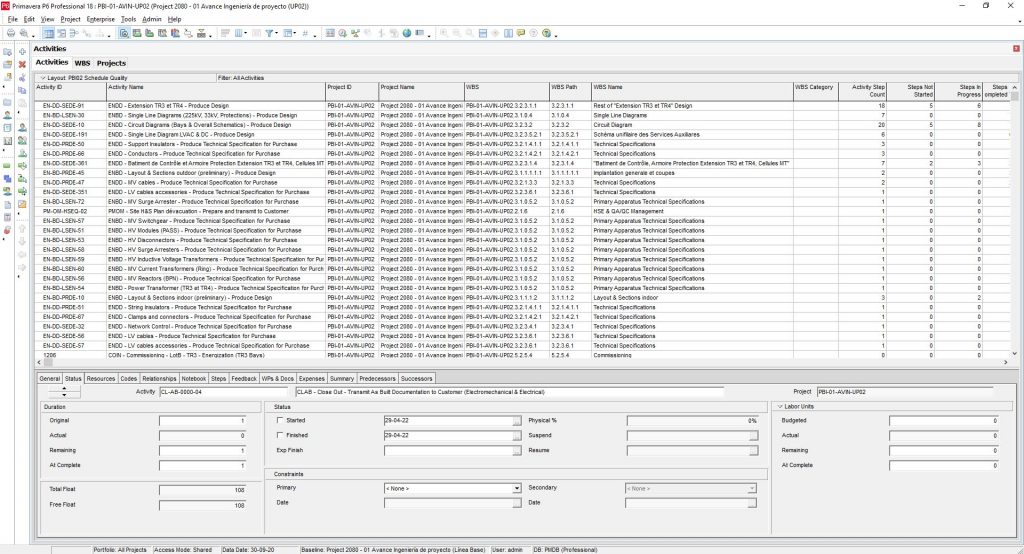
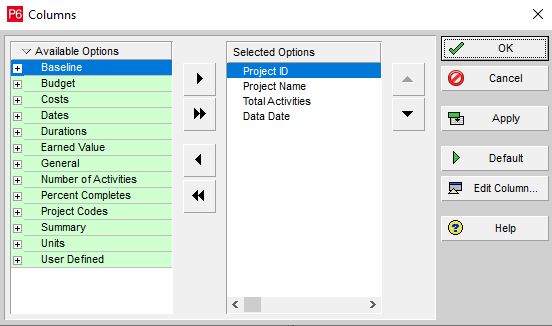
First, we will copy the data from P6 and paste it into an Excel spreadsheet, both for the data in the “Projects” window:
and data in the “Activities” window in P6:
Note that we have configured the columns to display. The columns of the “Projects” window that we have copied are the following:
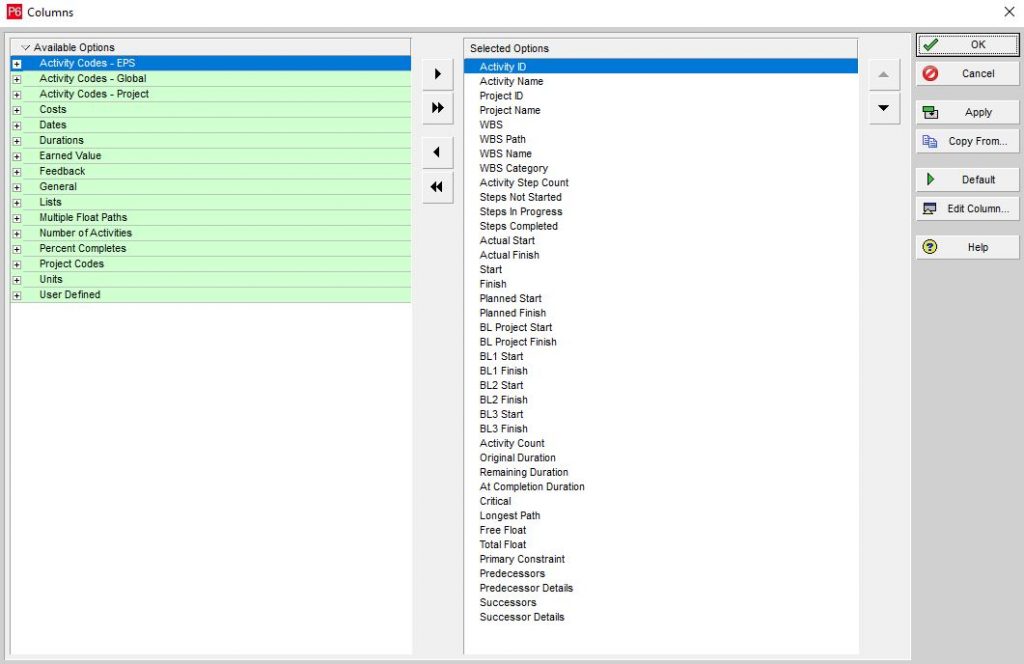
Regarding the “Activities” window, we have selected the following columns:
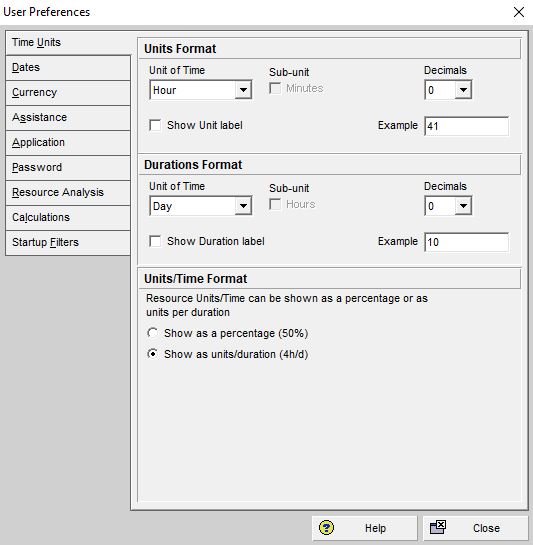
It is important to remember that when copying the data, within the preferences of the Primavera P6 user, we do not show either unit label or duration label:
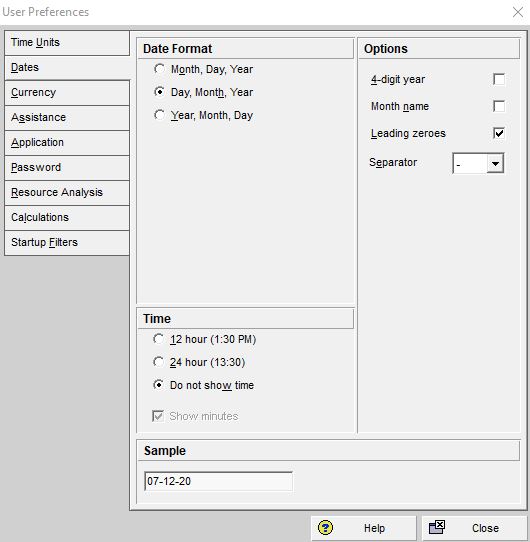
In the same way, within “User Preferences”, on the “Dates” tab, set the format aligned with the date settings in Excel and Power BI. In our case, the settings and configuration are as follows:
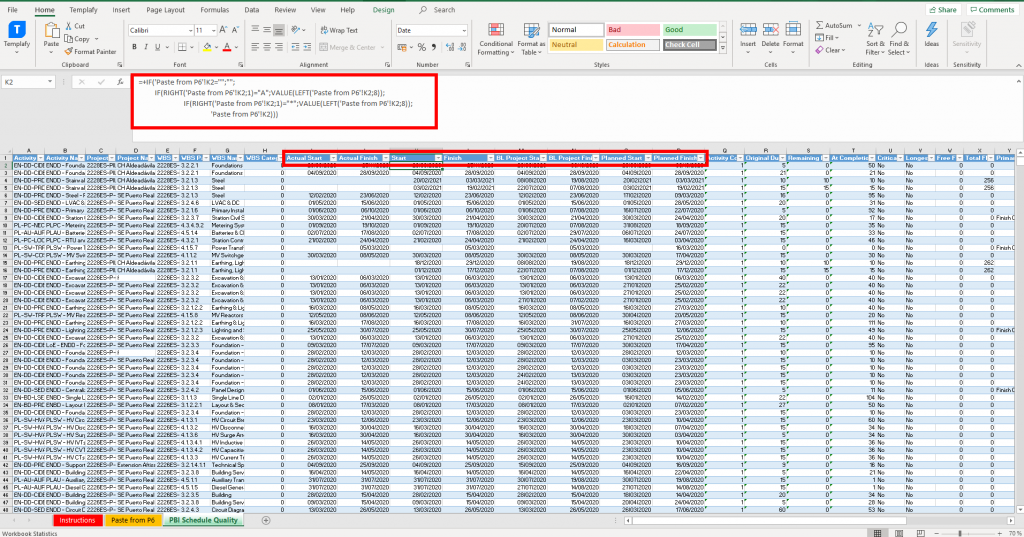
Once the data has been copied into Excel, it is time to create pivot tables of this data, since we are interested in taking the table already created. As you know, Primavera P6 identifies certain “events” on their dates (Start and Finish) with different characters. For example, it uses the character “A” to tell us that this activity´s date is declared as complete. P6 also uses the “*” character to identify which activity has some kind of constraint such as “Finish On”, “As Late As Possible”, etc. In order to not having issues with these special characters when transforming the data in Power BI, we must remove them from our pivot table.
In our case, we use three tabs within our Excel files: “Instructions”, to explain how to copy and paste data; “Paste from P6”, to copy the data as text; and “PBI Schedule Quality”, where we place the formulated pivot table. In the tab where the pivot table is located, the cells that correspond to the columns relative to dates, on top of giving them a date format, we formulate them as follows to eliminate the characters that represent the constraints or status mentioned in the previous paragraph:
Step 2: get data in Power BI
Once we add the Primavera P6 data in an Excel spreadsheet, it’s time to bring it to Power BI. To do this, within Power BI Desktop, we will go Start / Transform Data, since we will have to do certain transformations of our original pivot table in Excel:
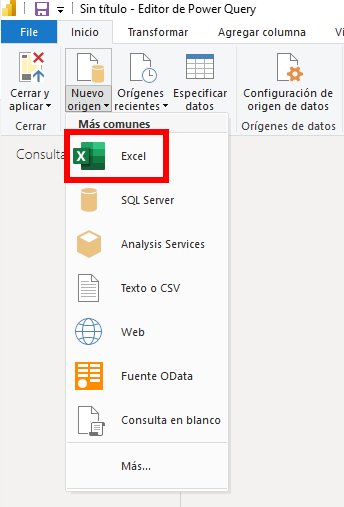
Next, we will create a new query and select, as a new data source, the “Excel” option:
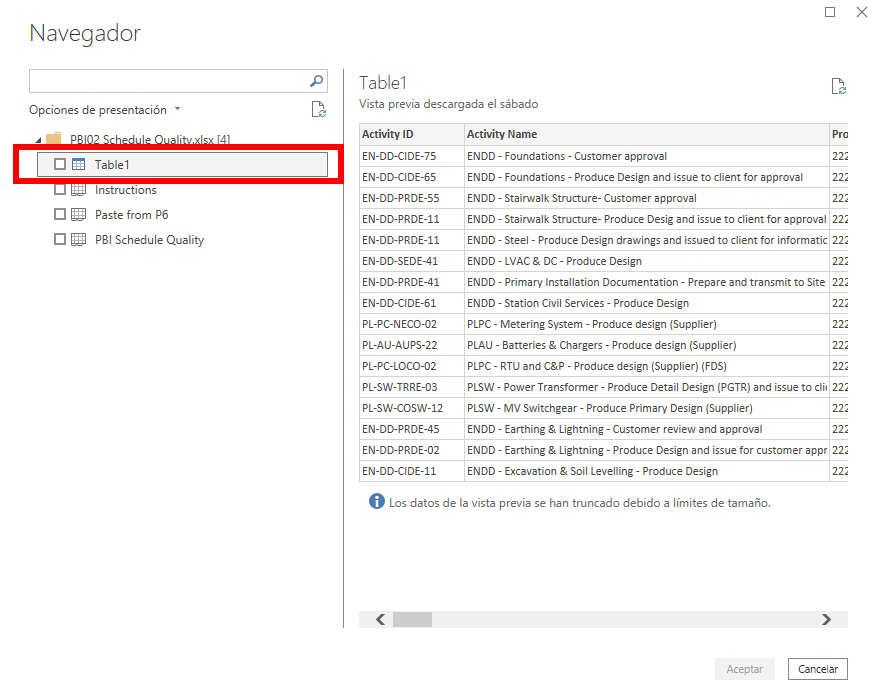
Once you select the file where you have your pivot table, a browser will open where the sheets of your file will appear, as well as the tables that you have created. In our case, we will select the table:
Thus, we have just linked our Excel file with Power BI.
Step 3: transform data with Power Query Editor
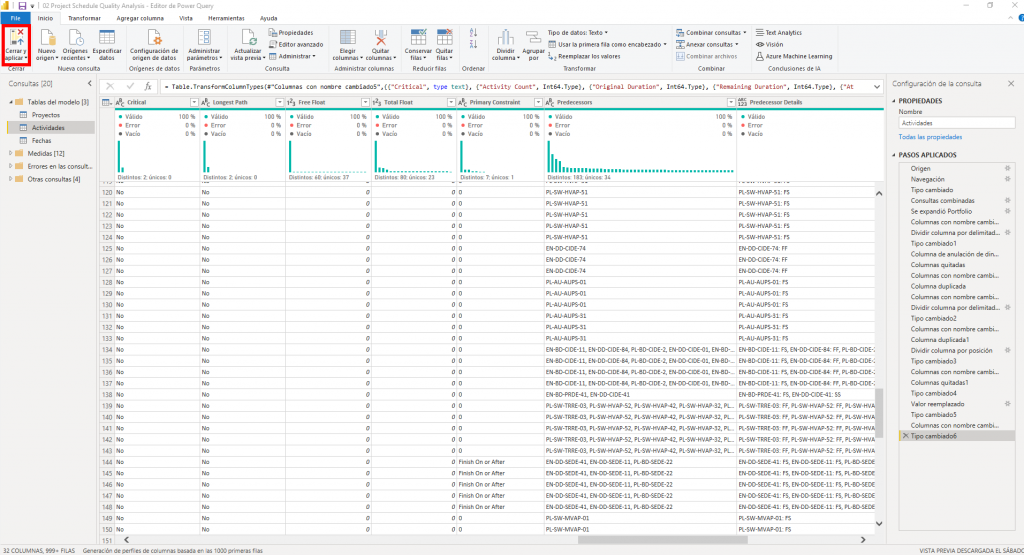
They would now be connected and ready to work in the Power Query Editor. From now on, our ability to transform data within Power BI would come into play: managing columns, reducing rows, sorting fields, dividing columns, grouping, combining queries, and other functions related to artificial intelligence. Once we have configured our new query we can “Close and apply”:
Step 4: model data
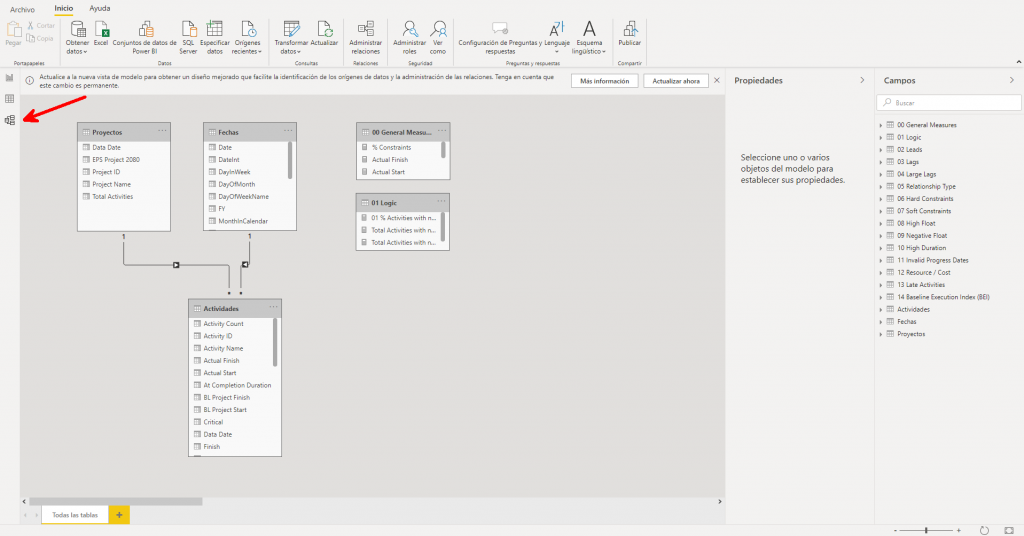
A step prior to starting the development of our dashboard in Power BI consists of modeling the data sources and managing the relationships between them. This is where some of the magic of Power BI lies. A feature that opens a new world for planning and project controls specialists. To be able to model, we will go to the “Model” tab that is located on the left-hand side of our screen and we will begin to link the different tables.
We must distinguish three different types of tables. There will be tables called “Lookup Tables”, which will help us to segment our visualizations; “Data Table” or “Fact Table”, where all the data to be analyzed stay (dates, number of activities, relationships, etc.); and the “Measure Table”, which represent the measurements that we have created to be represented in our visualization or dashboard. In our example, the tables and relationships we have created are:
Step 5: create new measures
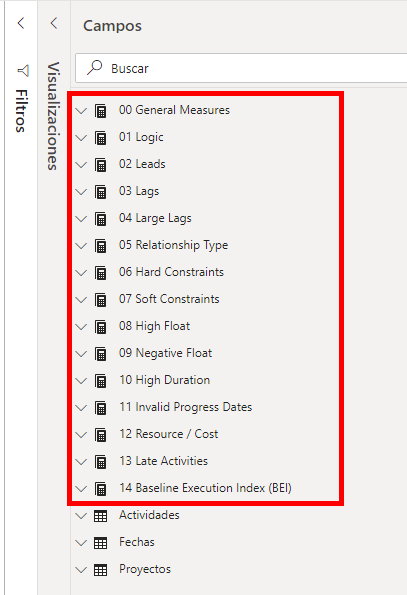
This step is where the data calculation is. The creation of measures will dynamically perform calculations based on the data in our “Data Table” or “Fact Table”. Measures are a key and powerful Power BI point since they will allow us to display almost any type of data within our dashboard. For the example in this post, the measures we have created refer to each of the 14 points that the DCMA takes into account for assessing the quality of project schedules. If you want to know more about this topic, you can take a look at our post about how to do the project schedule quality assessment.
Step 6: Power BI visualizations to create your dashboard
We are now in a position to unleash our creativity and start assembling our dashboard in Power BI. To do this, we must make use of the visualizations that Microsoft Power BI offers us, in addition to other elements such as text boxes, geometric figures, etc.
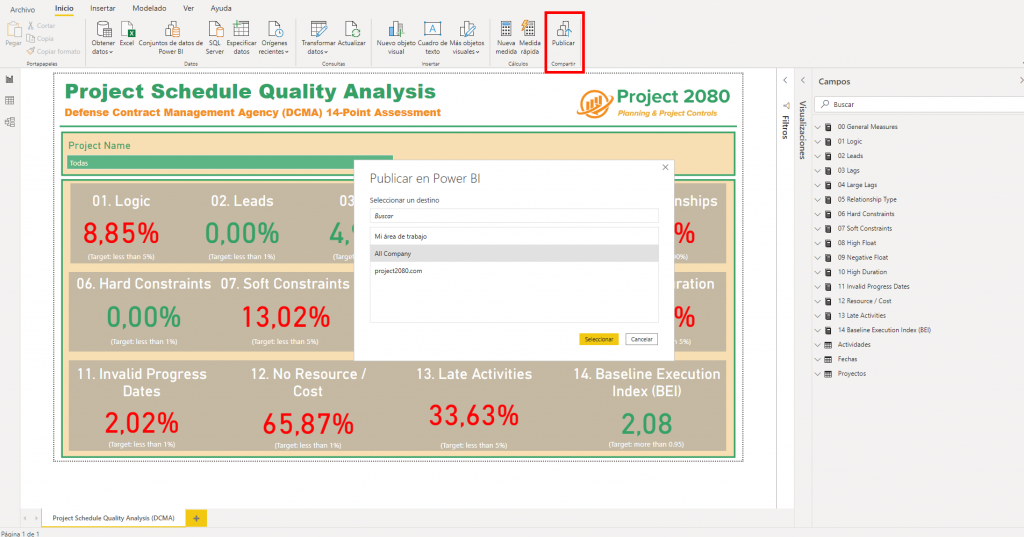
Step 7: once you connect Primavera P6 to Power BI, it´s time to publish
Last but not least, we get to the point where we will display our new dashboard. A scorecard made in Power BI with data that comes from the Primavera P6 planning tool to our project team. This will serve to analyze in a more dynamic way and in real-time, the status of our projects. To do this, you simply have to go to the “Publish” option. Voilá, our new report will go from Power BI Desktop to be visible on our organization’s Power BI website.
IN PROJECT 2080 WE WOULD LIKE YOU TO REMEMBER
The era of Power BI has arrived. The planning and project controls have taken a quality leap never seen before. Now it is within everyone’s reach to be able to link and crosscheck databases and visualize any type of relevant KPI. Knowing how to connect Primavera P6 to Power BI is only the first step. The creation of models and visualizations in a job that takes some practice and knowing how to unleash our creativity. Once you get it, you will forget all those hours you spent in front of an Excel sheet.




18 July, 2022 @ 10:25
Interesting reading. Many of the needs described in the post can be obtained by setting a good structure of wbs/activities codes in P6, by using reports. As far as I understood from article, by Power Bi I could add easily graphs and other correlations between data. I immagine that we could add also calculations to create temporary parameters to customize specific KPIs.
18 July, 2022 @ 11:17
Thanks for your message, Massimoluigi.
You are right. Power BI transforms datasets into good-looking visualizations. It turns unrelated sources of data into coherent, visually immersive, and interactive insights. Your data may be an Excel spreadsheet or a collection of cloud-based and on-premises hybrid data warehouses. Power BI lets you easily connect to your data sources, visualize and discover what’s important, and share that with anyone or everyone you want.
If you want us to prepare specific content, please let us know.
Regards,
26 August, 2022 @ 16:40
Very interesting, is it possible to receive privately your excel file?
So to understand the framework of the three worksheets?
Thanks in advance
Federico
26 August, 2022 @ 17:24
Hi Federico
Thanks for your message. We are currently out of office. On Monday we will send the file to you. We hope that is ok for you.
Regards,
13 September, 2022 @ 15:38
Hi ,
can you send me the excel template, I want check the instruction sheet. yousif.cpp@gmail.com
thank you
22 September, 2022 @ 18:34
Hi Yousif,
when you join our community, you will receive a gift that includes both excel files and power bi file for the DCMA report.
Regards,
1 October, 2022 @ 01:01
Prezados
Otimo assunto, me enteresso muito. Gostaria de receber os arquivos para conseguir fazer o relatório em PowerBI. E possivel? Segue email: tiago-santana2008@hotmail.com.
aguadeço a atenção.
25 October, 2022 @ 08:47
Hi Tiago,
when you join our community, you will receive a gift that includes both excel files and power bi file for the DCMA report.
Regards,
12 December, 2022 @ 23:25
Hi,
I have joined the community but I have not received any file. This article is interesting but missing step. Requesting you to please elaborate.
Thanks
28 December, 2022 @ 17:07
Hi Sajith,
thanks for your comment. Please, click on this URL to download the file. We will find out why you did not received the URL when you joined the community.
Regards,