How to make a Gantt Chart step by step
In our post about what is a Gantt Chart we show you a first approach to one of the most used tools in the Project Planning and Project Controls world. In this post, we are going to teach you how to make a Gantt Chart step by step so that you can become a true expert in bar charts.
As is usual in our posts on Planning and Project Controls, the tool with which we are going to know how to make a Gantt Chart step by step will be Primavera P6 from Oracle. We also want to highlight that the next steps to follow are aligned with Earned Value Management.
How to make a Gantt Chart step by step
Step 1. what is the project scope
The first step to follow when we face the question of how to make a Gantt Chart step by step is to know the scope of the project. The scope of a project is the sum of all the parts required to reach a project completion milestone. These work packages of the project can be of a different nature, such as engineering package, purchasing package, logistics package, work execution package, or project closure package. Each of these packages will in turn contain different sub-packages that will house the different tasks to be carried out to complete the project.
In addition to the work packages that we have identified, the different contractual milestones and/or milestones are also part of the scope of a project that, despite not being contractual, will serve to monitor the project on a regular basis.
For this post, we have chosen a project whose scope is the manufacture and assembly of 25 “sleeper cars” on a railway production line, with a total duration of 44 months.
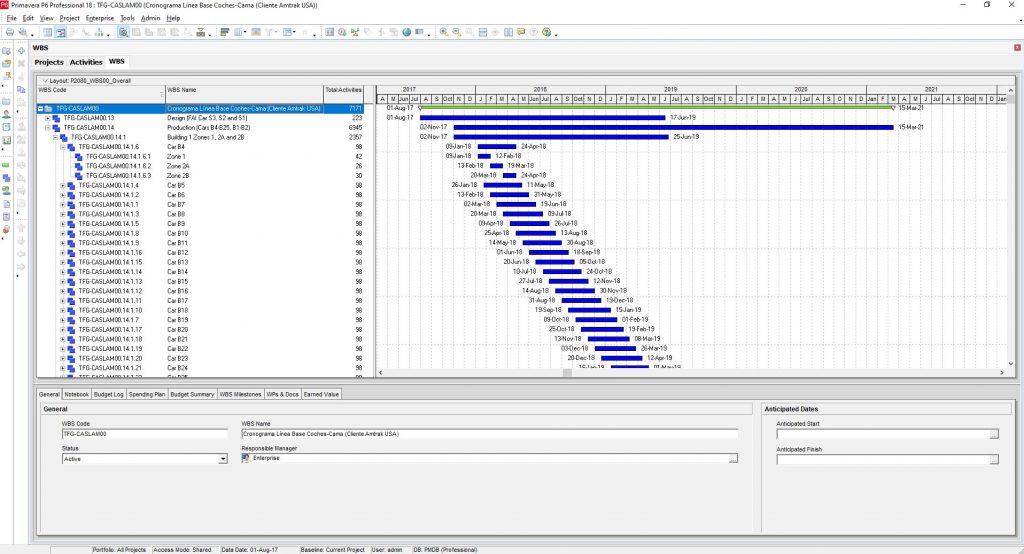
Step 2. Define the Work Breakdown Structure (WBS)
Once we know the scope of our project, within traditional project management, one of the tools to describe it clearly is the Work Breakdown Structure (WBS). You can visit our Project Scheduling Glossary and learn more about what is a WBS.
A good Work Breakdown Structure (WBS) is already halfway in the achievement of a project. That is why we recommend guiding the WBS of each project correctly. In this way, the WBS can focus on:
- Deliverables
- Tasks or Activities
- Project Phases
- Mix
When creating the Work Breakdown Structure (WBS) for our project under study, we have taken into account the following project constraints:
- There are 2 assembly buildings in the factory, which in turn are made up of different zones: 3 zones in the first building and 7 zones in the second building
- among the 25 sleeper cars to assembly, there is only one considered as a prototype
- prototype car must be approved by the client on every single zone, before the rest of cars start on that zone
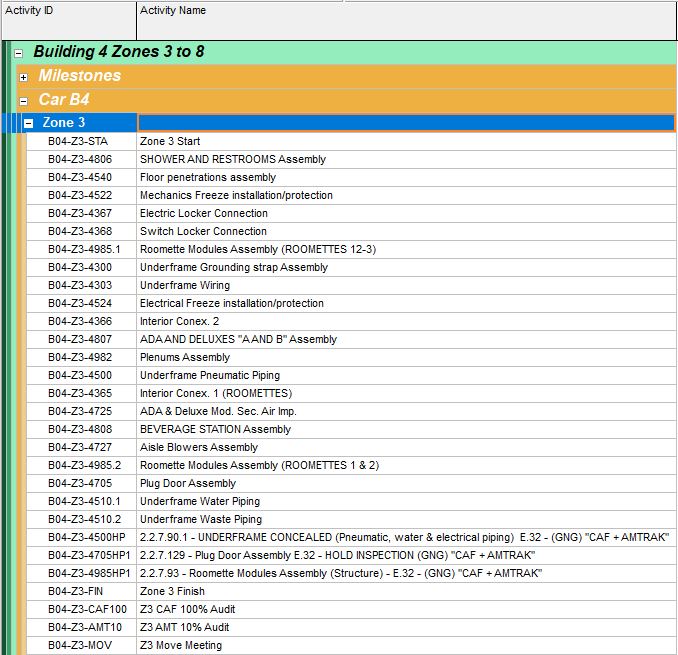
Step 3. Create a list of activities
You have already seen that making a Gantt Chart step by step in Primavera P6 is very simple and a matter of organization. Create packages and sub-packages that are able to organize and show the scope of our project in a simple way. Once we know the scope of our project and we have divided it into packages thanks to our WBS, it is time to see what activities make up each of those packages. We already talked about this step in our post about the collaborative planning meeting.
When defining or creating the list of activities for a project, we try to create only activities that can be measurable during their lifetime within the project. And in cases where the activities are not measurable, we turn to Galileo Galilei when he said: “measure what is measurable, and make measurable what is not”.
In the project on which this post is based, we have identified all the activities that take place in each of the assembly areas. This list of activities also includes intermediate milestones that can be “gates” to new areas. These milestones will help us to create specific reports at the project management level.
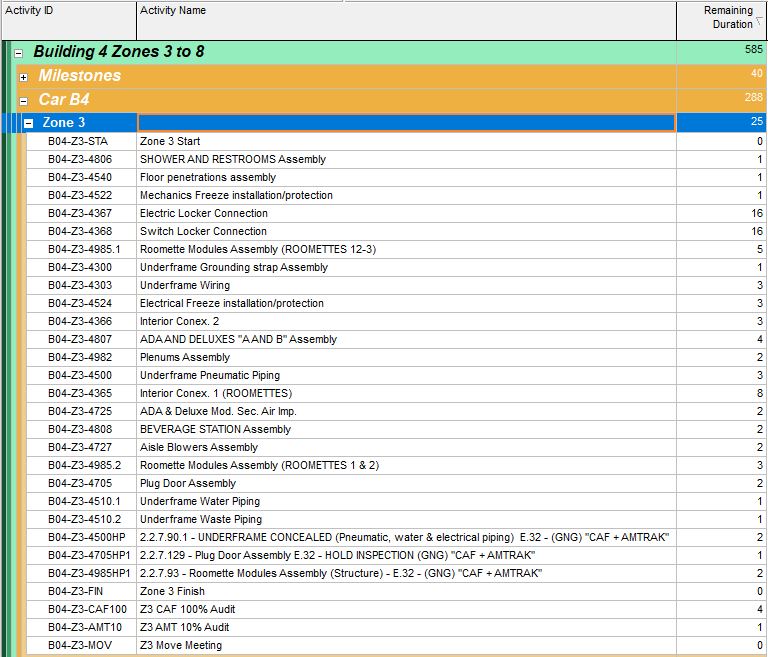
Step 4. Calculating activity durations
We have almost reached the end. But one of the key points remains to know how to make a Gantt Chart step by step. This is to calculate the duration of each of the activities. For this, we can base ourselves on experience or make an assessment of what resources are necessary for these activities to be carried out. We are talking about resources such as materials, labor, or specific machinery.
In our project, we have relied on the man-hours needed to do the different assembly, electrical, painting, and other jobs required on a train production line to calculate the duration of our activities.
Step 5. Activity Relationships
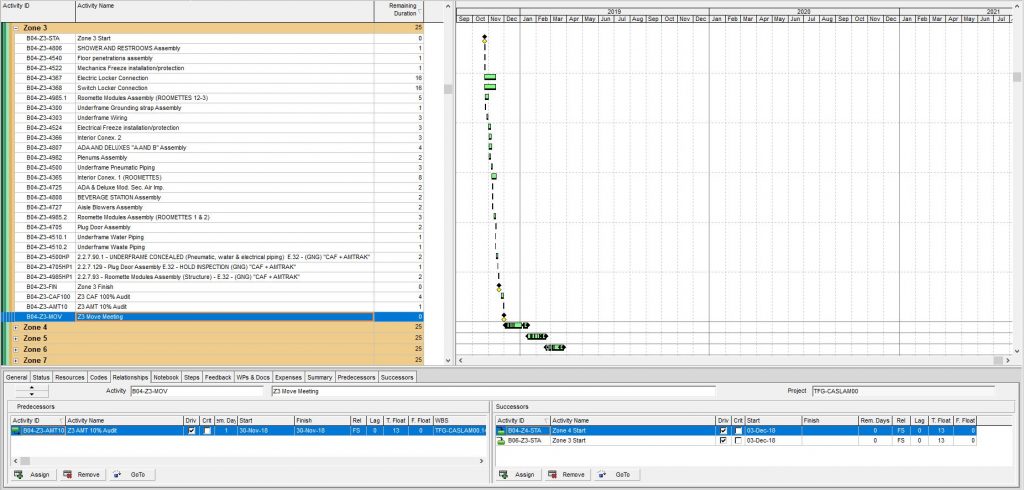
The last step we need to do before we can create a Gantt Chart is to relate each of the activities. A golden rule of thumb in project planning is that all activities, except the start milestone and the finish milestone, must have at least one predecessor activity and one successor activity.
In our example, the relationships between activities have been carried out, first, taking into account the logical relationship between activities to be carried out during the assembly of a sleeping car. And second, taking into account the restriction that there cannot be 2 sleeping cars mounted at the same time in the same area.
Once we relate all the activities with others, adding predecessor and successor activities, we press the calculate button (F9 in Primavera P6) and all the activities will be reallocated in time.
Gantt Chart on Primavera P6
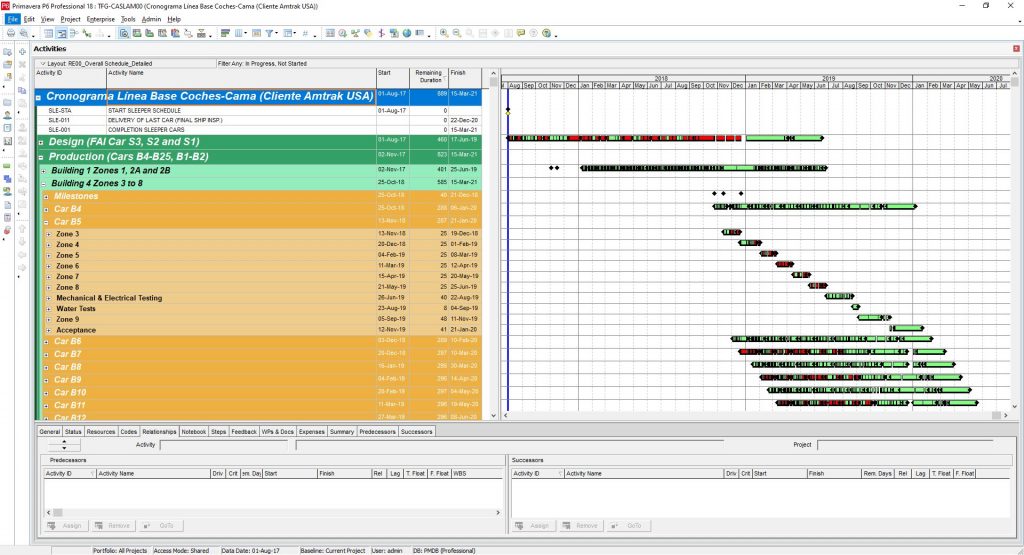
It is done! We have reached the point where we can see our project fully represented by a horizontal bar diagram, located in time thanks to the duration of each of the activities that feed the WBS (Work Breakdown Structure) of the project. Thanks to Primavera P6 we will be able to show the levels of detail that we have defined in the definition phase of the WBS (level 1, level 2, level 3, etc). This would be a summary Gantt Chart case. We can even see a Gantt Chart in Primavera P6 at the activity level. This is very useful when we have to present reports of critical activities where we are interested in seeing the day-to-day of these activities in order to analyze or manage risks in a more detailed way of the project.
One of the options that Primavera P6 offers us is that, even though we are showing a summarized Gantt Chart, we will be able to see if there may be critical activities at that level of WBS since critical activities can be displayed with a different color from the ones not critical. That’s where the project planner’s artistic judgment comes in.
Next, we show you what the Gantt Chart of our project would look like in Primavera P6.
IN PROJECT 2080 WE WOULD LIKE YOU TO REMEMBER
The Gantt Chart of a project is one of the most important points in project management. It is the tool that the project manager has to control and analyze the progress of a project, from an activity point of view, as well as from a point of view of the project phase to be analyzed. We have shown you how to make a Gantt Chart step by step in Primavera P6. However, you can also use other tools such as Microsoft Project, a spreadsheet, or some other software that you can find on the net for this purpose.
If you want to know more about us, visit our YouTube Channel and subscribe to receive our new content.

