What is Project Controls process?
This post will teach you what is Project Controls process in 5 steps.
Step 1: to create project baseline
What is Project Controls process is the keyword. However, do you know how to project controls with no knowledge about what we want to control within the project? This is a tough task to implement. If we do not have a good project baseline, we will not be able to properly monitor and control the project. In other of our posts, we already talked about what a project baseline is. But what is project controls process taking into account the project baseline?
Our project baseline must be able to clearly encompass the scope of the project, the resources necessary for the execution of the project, as well as the costs of the project. These are the three project monitoring and control mechanisms that we use in Project 2080. Our experience tells us that these three pillars support a solid project baseline, which is the foundation of adequate project monitoring and control.
The critical path of the project
Finally, the project baseline will be that initial photograph against which we will compare the progress of our project on a regular basis. Thanks to this first baseline activity schedule, we will know the critical path of our project, the key to monitoring and controlling the most critical activities of our project. If you want, you can refresh your knowledge in our post about what is the critical path of a project.
Step 2: what is Project Controls process thanks to S-Curves
Once we have our baseline activities schedule, the critical path and sub-critical paths of the project, we are in a position to obtain different S-curves of the project. These S-curves owe their name to the fact that when relative values are accumulated at the origin in time, their shape resembles a flat “S”.
The S-curves are obtained once the different resources have been entered into the activities of our schedule. Except for the activities that are part of the critical path, whose float is zero time units, the rest of the activities have some total float. This causes 2 types of curves to be obtained. These S-curves are called the Early Baseline and the Late Baseline.
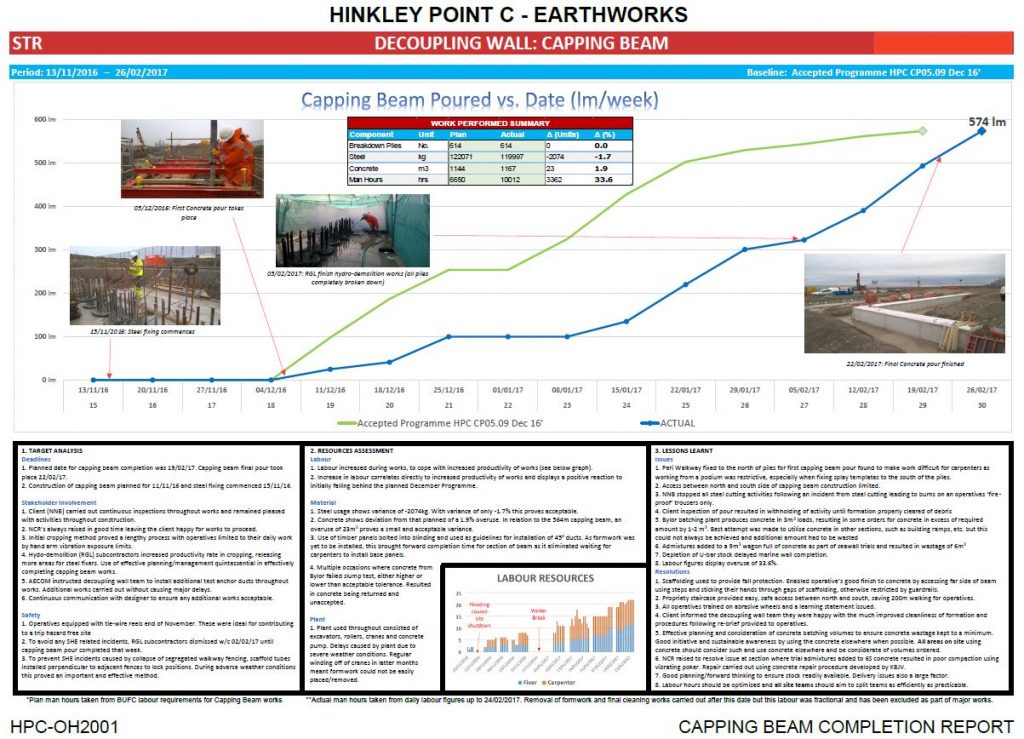
Finally, we will also be able to obtain S-curves according to the project phase or work package that we want to control and monitor. Below, you can see an example of an S-curve that was used to control a capping beam in the construction of a reinforced concrete decoupling wall:
Earned Value Method
The Earned Value Method is one of the clearest methods for tracking a project. What is Project Controls process thanks to the Earned Value Management? The monitoring and control of a project using the Earned Value methodology is carried out taking into account the different S-curves that are generated during the execution of a project.
Below you can see an interactive chart to refresh your knowledge about Earned Value Management:
Step 3: KPI definition
What is Project Controls process when KPI plays a key role to control and monitor a project? Very easy. The Key Performance Indicators or KPIs are those indicators that are used to measure all kinds of variables of a project, such as the progress of certain phases or work packages that, due to their nature, are necessary to synthesize and analyze regularly. These performance meters help us, therefore, to analyze different elements of the project, as well as to make decisions. They offer us a global and simplified vision of the project.
When defining these performance indicators or KPIs, we must take into account:
- what kind of packages or elements we want to control. For example, a KPI could be the m3 of concrete to be poured on site.
- what data we need and where to get it to obtain the information we need. In the case of our example, the data we need would be obtained through the delivery notes of the concrete tank truck, or the concreting plant.
- assign them an objective value or a range of values in which we must move. Continuing with the previous example, the KPI could be not to concrete less than 2,000 m3 of concrete per day due to the capacity of the concrete plant that supplies us with material on site.
- set the frequency with which they will be analyzed (daily, weekly, monthly, etc.). To finish with the previous example, we want to monitor progress on a daily basis.
In the same way that it is done for a project, different target KPIs can also be marked within a project schedule. For example, a performance indicator would be the number of activities with total float of less than 10 days that have been delayed with respect to the update of the previous period. The value should not exceed 2% of the delayed activities in the current period. Another performance measure could be the number of activities with a total float greater than 40 days. In this case, the value should not exceed 5% of the total activities.
Step 4: dashboard
Once the project baseline has been created, the S-curves have been generated after incorporating resources into the activities within the baseline schedule, and the Key Performance Indicators have been defined to measure some project variables, do you know how it is carried out? the control of a project in the most optimal way possible, quantitatively speaking? Through a control panel, also called a scorecard or dashboard.
The dashboard is the tool that will help us to know, from a quantitative point of view, the situation of the project based on its main control metrics. These metrics will be compared with the objectives set at the beginning of the project.
It should be said that the dashboards or control panels can be made globally within the project, or individually for each of its phases. In this way, we might have an operational control panel. However, we might have a control panel for monitoring and control of the engineering, purchasing, and logistics phase, construction phase, etc. In all of them, it is important to never forget the objectives that were set during the project baseline preparation phase, as well as implementation dates, delays, responsible for controlling each objective, as well as any type of comment or additional material that complement the dashboard.
Step 5: project follow-up meetings
During the follow-up meetings, the objective will be to collect all the necessary information on the current situation of the project, the status of risks and opportunities, and the progress of ongoing activities. The intention is to see possible deviations, in addition to whether any risk or opportunity has been generated in the project that we must begin to control.
Follow-up meetings are held periodically. The nature of the project, its level of risk or criticality, or its budget will help us better assess how often these follow-up meetings will be held. You should not confuse a follow-up meeting with a collaborative planning meeting.
It is in these meetings where the 4 previous steps are put on the table to carry out the monitoring and control of your project. The KPIs are analyzed. The current situation is compared with the project baseline. And finally, we also look at the different S-curves of progress or the analysis of the added value of the project. Normally, these meetings are attended by the heads of each department, as well as the person responsible for planning and project control.
Once the follow-up meeting is over, all the parties involved are informed of the countermeasures or active measures to be carried out during the following period.
IN PROJECT 2080 WE WOULD LIKE YOU TO REMEMBER
At this point, we believe that you already know everything you need to know about what is Project Controls process in 5 easy steps. However, your opinion interests us. Therefore, if in addition to the project baseline, the S-curves, the definition of the KPIs, the control panel, or the follow-up meetings, you think there is something else that escapes us, leave us a comment below. And remember, almost anything can be measured, controlled, and tracked.


